


Illinois researchers map farming trends from space
By HANNAH SPANGLER
FarmWeek
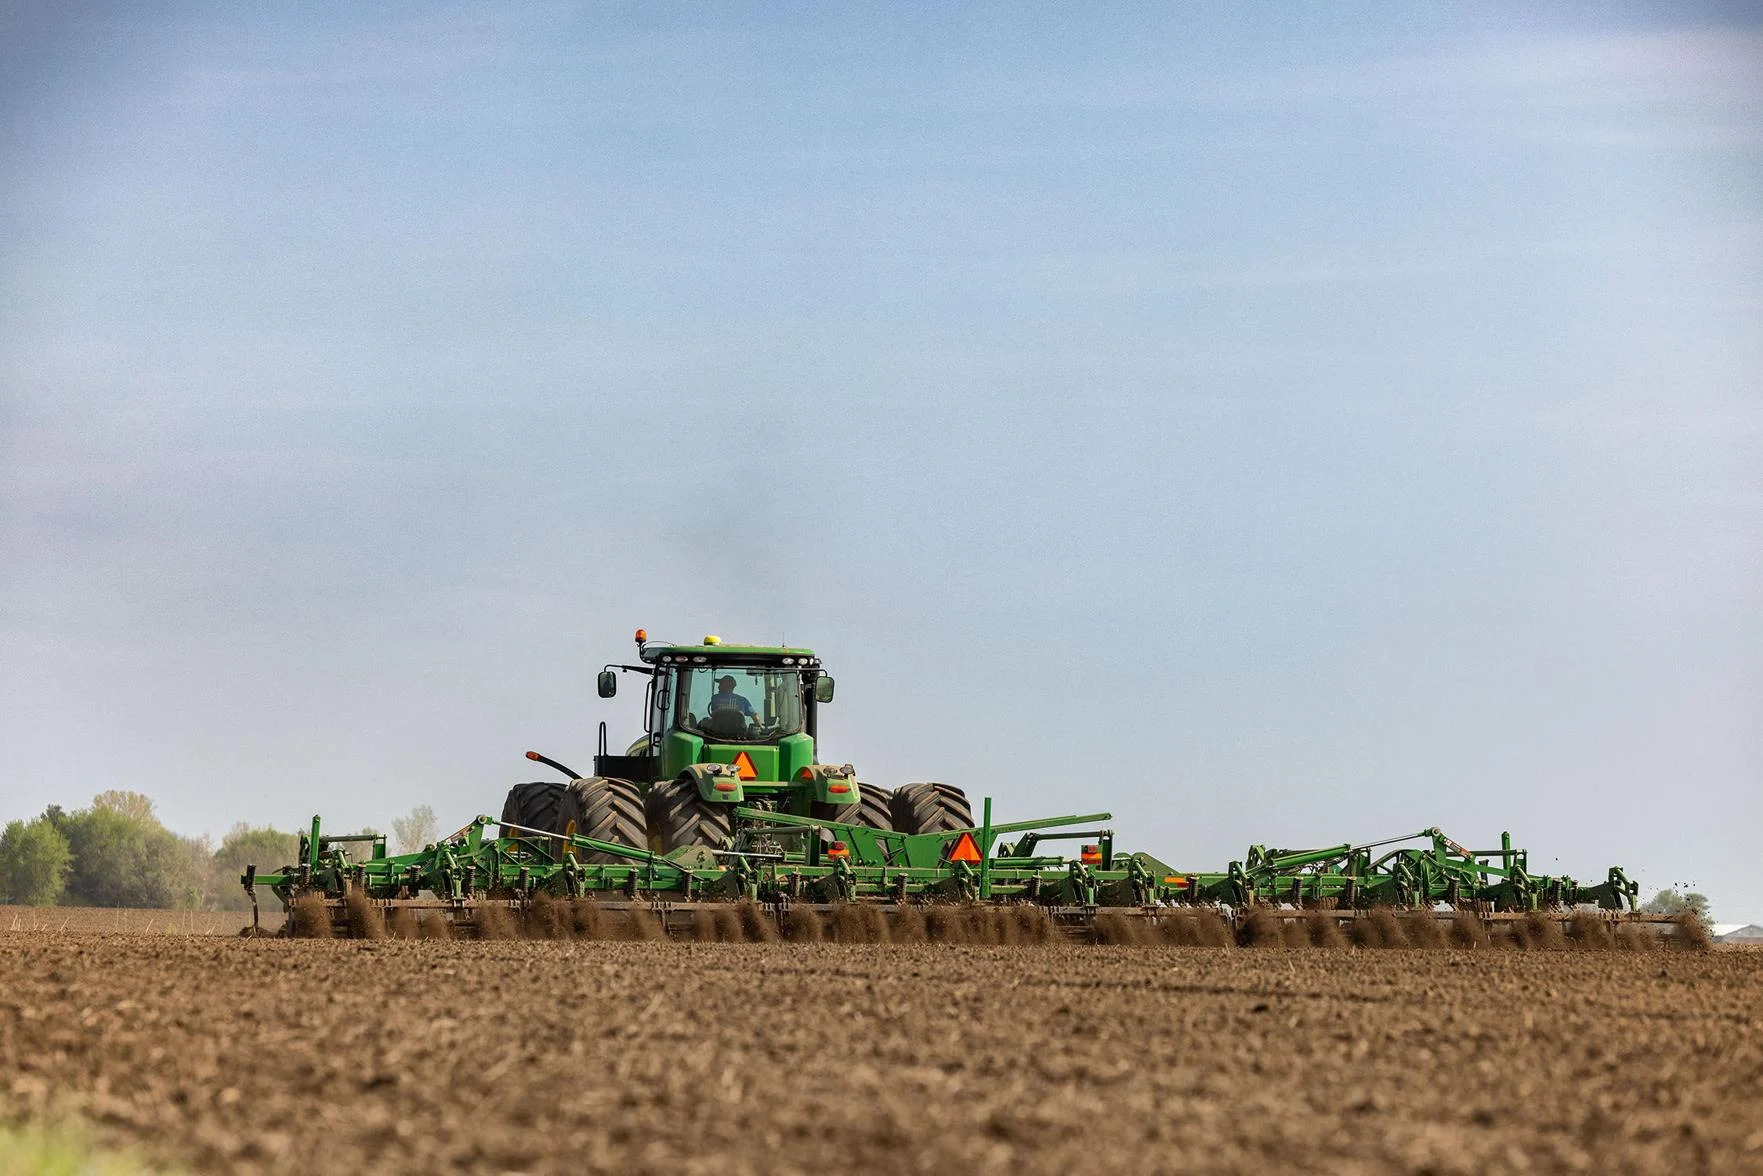
Conservation tillage practices such as no-till and strip tillage play a key role in soil health and resilience. But understanding where, when and how often those practices are used across the Corn Belt has been a challenge.
Researchers at the University of Illinois are taking a unique approach with satellite imagery and machine learning to better track tillage practices in the Midwest. The new “dynamic framework” mapped corn and soybean fields from 2000 through 2022, creating one of the most detailed long-term looks at regional tillage trends. It’s another major innovation from the Agroecosystem Sustainability Center, led by Kaiyu Guan, founding director of the center and professor.
“Mapping tillage practices across large areas is important to quantify the long-term impacts on soil health, erosion and water management. But current data are mainly obtained from farmer surveys,” said Xiaocui Wu, a U of I research scientist on the team who detailed the methodology and findings in a new paper published earlier this month.
While useful, survey datasets often do not capture year-to-year changes or field-level variability, Wu said. Other information comes from satellite imagery that estimates crop residue as a proxy for tillage, but those approaches are often limited to smaller geographic areas.
“In small regions, soil and climate conditions are usually similar, so researchers can apply a fixed threshold to separate tillage practices,” Wu told FarmWeek. “But when you apply that approach across larger regions, soil type, moisture, precipitation and temperature are all very different, and satellite signals vary across space and time.”
**Editor’s Note: If you find the story here of value, consider clicking one of the Google ads embedded in the story. It costs you nothing but Google will give the website owner a few cents. This is a way to help support local news at no cost to the reader.
The research team addressed what other studies and information on tillage lack by using a framework that combines satellite‑based crop residue indicators with environmental variables such as soil and weather conditions. Machine learning models adjust satellite data thresholds by county and year, rather than relying on a single static value, which dynamically determines tillage practices at local scales.
Researchers classified tillage into three categories — no-till, reduced till and conventional tillage — focusing on the Midwest’s primary corn and soybean production region across 12 states, including Illinois and Iowa.
Results showed conservation tillage has increased gradually across the Midwest over the past two decades, but adoption patterns vary by crop and region. In Illinois and southern Michigan, conventional tillage has slightly increased, while reduced tillage has slightly declined in corn systems over the past two decades. In soybean systems, the shift has been less pronounced, but trends generally moved toward greater use of reduced tillage.
In contrast, no-till adoption increased steadily across parts of the eastern Great Plains, Iowa and southwestern Minnesota for both corn and soybean systems, often replacing reduced tillage. No-till adoption is generally higher in drier areas, such as the Great Plains, where leaving residue on the soil surface helps conserve moisture. Warmer regions also have higher adoption rates because slower soil warming under residue is less likely to delay planting.
“The tillage map is a starting point,” Guan said, explaining from here, farmers and policymakers can use these maps to understand the long-term impacts of tillage decisions.
With a clear picture of how tillage practices vary by region, crop and year, Guan added, researchers can begin linking those patterns to outcomes such as soil health, water movement and crop yields. The broader view could then help policymakers evaluate whether conservation programs are having the intended effect and where additional outreach or incentives may be needed.
At the farm level, insights into how to connect tillage history with long-term crop yield resilience and variability would help farmers make better management decisions. By better understanding how practices like no-till or reduced tillage perform over time and under different conditions, farmers may be able to weigh tradeoffs and adjust their systems accordingly.
“Farmers have so many different decisions to make. So having some more data-driven insights will help,” Guan said.
This story was distributed through a cooperative project between Illinois Farm Bureau and the Illinois Press Association. For more food and farming news, visit FarmWeekNow.com.